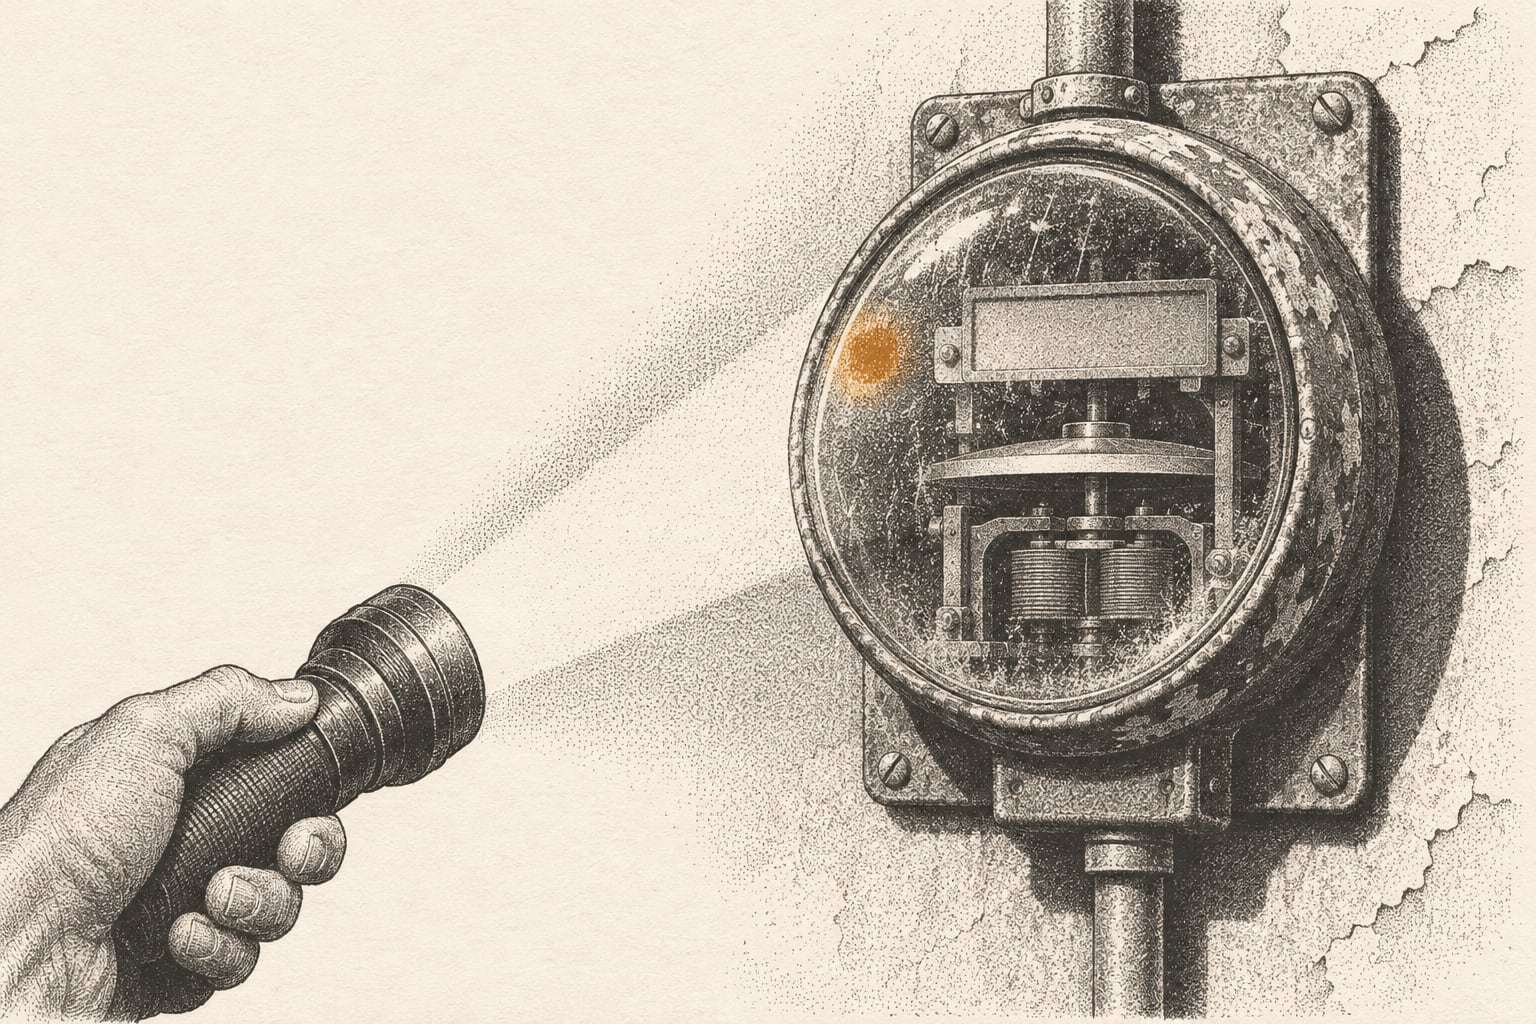
Every energy project ends with a claim: this site uses less than it did. That claim rests on a quieter fact that is easy to skip. Someone has to know which meters belong to that site, and only those.
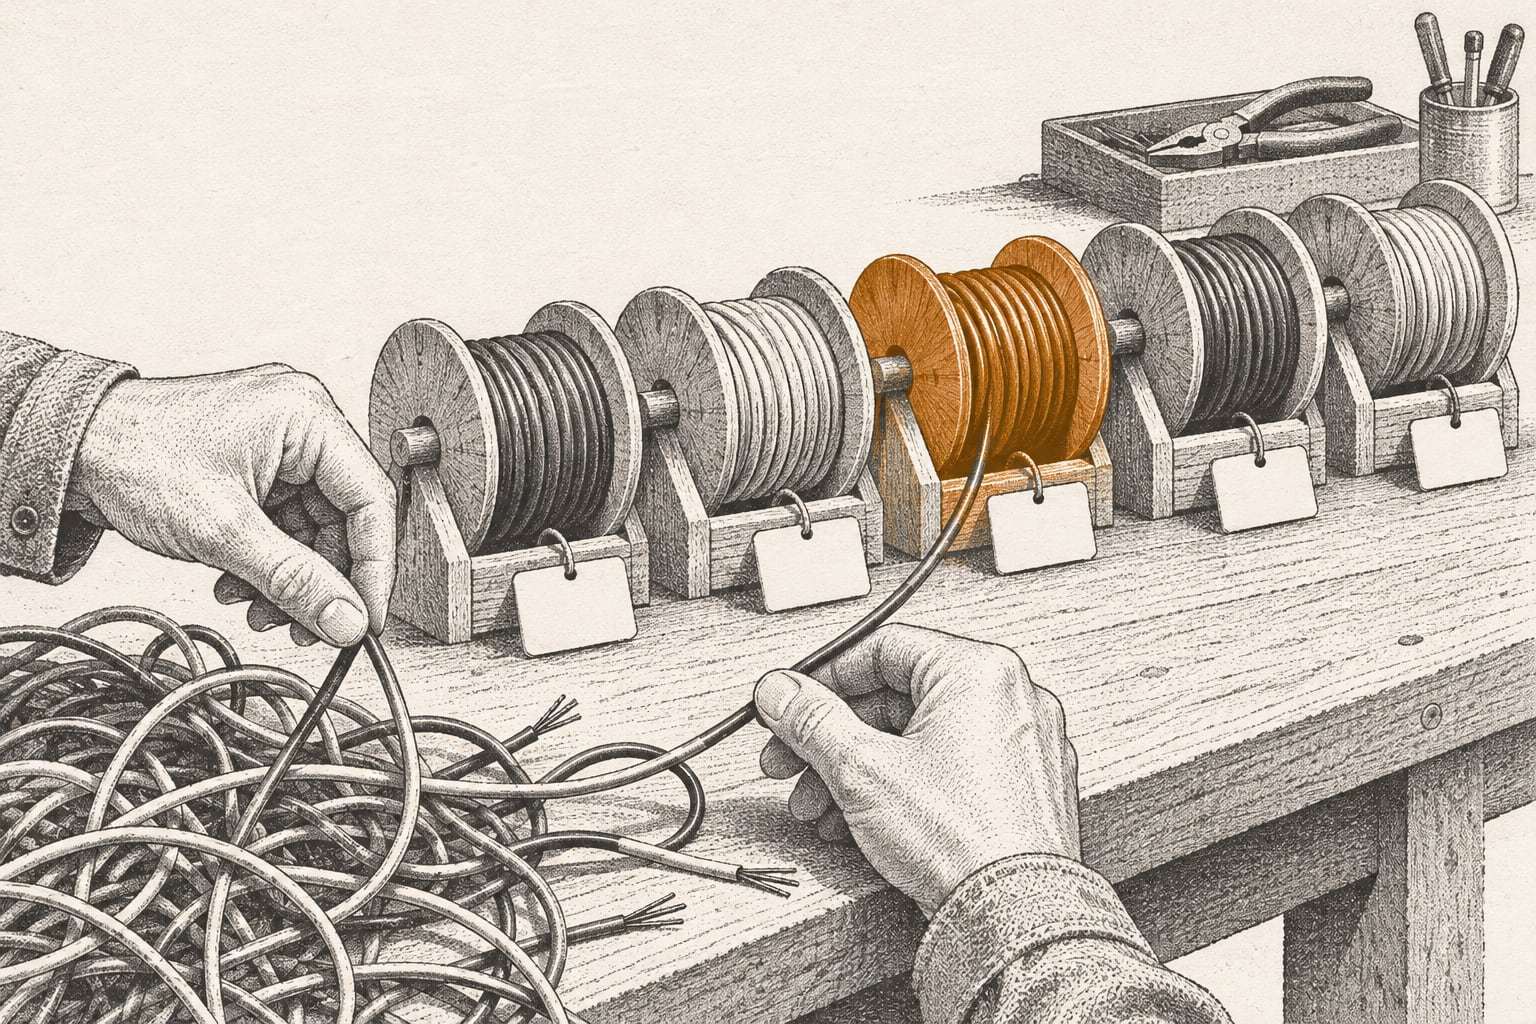
A meter map is the list that ties every utility meter to a site, an account, a cost center and a general ledger code. It is not glamorous work. It is the reason later numbers can be trusted, and the first thing that breaks when a portfolio grows.
What a meter map holds
At its simplest, a meter map is one row per meter. The columns carry everything needed to match a bill to a place and a budget.
| Field | Why it matters |
|---|---|
| Utility and commodity | Electric, gas, water and sewer each follow their own tariff |
| Account number | How the utility bills, and what accounts payable pays |
| Meter number | The physical device; changes when the meter is swapped |
| Service address or premise ID | The location the utility serves |
| Site ID and name | Your name for the place, used in every report |
| Cost center and GL code | Where the expense lands in the books |
| Rate schedule | The price list that applies |
| Interval data | Whether 15-minute data exists, and how to get it |
| Status and dates | Active, closed or transferred, with the date and reason |
Some portfolios add square footage, operating hours and the facilities contact for each site. Those help later, when you compare sites, but the nine fields above are the core.
Why the map comes first
Four kinds of work depend on the map being right.
- Savings claims. A lighting retrofit at one store cannot be measured if half that store’s load sits on a meter mapped to the store next door.
- Budgets. Next year’s forecast is built site by site. A meter missing from the map is a cost missing from the budget.
- Benchmarking. Portfolio Manager scores a building on the meters you attach to it. ENERGY STAR says nearly 25% of U.S. commercial building space is already actively benchmarking in Portfolio Manager, and each of those scores is only as good as its meter list.
- Cost allocation. Finance splits utility cost by department, tenant or brand. The split is wrong if the meters behind it are wrong.
None of this needs a sophisticated tool. It needs a list that someone keeps current and two departments agree on.
Where maps usually go wrong
The same patterns appear in most portfolios that have grown by opening, buying or leasing sites over several years.
- One site, many accounts. The main building, a sign, a parking lot light, an irrigation controller and a gas meter can each bill separately.
- Meter swaps. The utility replaces a meter and the meter number changes. The old number lingers in the map.
- Account changes. A tenant moves out, an entity is renamed, a site is sold. The account number changes while the meter stays.
- Shared and master meters. An office building may have one master meter feeding several tenants, or a house meter for the common areas.
- Orphan accounts. A closed store still billing a minimum charge, paid every month because nobody connected the account to the closure.
- Address errors. A service address one digit off ties a neighbor’s meter to your account.
Each of these is ordinary. Together they make the map drift away from reality one change at a time, and nobody notices until a number stops making sense.
A first map in a week
For a portfolio of 20 to 100 sites, a working first draft usually takes about a week of part-time effort. Work from both ends: what you pay, and what the utility says you have.
- Pull what you pay. From accounts payable, export every payment to every utility for the last 12 months, with account numbers.
- Pull what you have. Download one recent bill for every account and record each meter number, service address and rate schedule.
- Ask the utility. Request a list of every account under your customer number or tax ID. Compare it to the payment export.
- Match to sites. Join each meter to your site list by service address. Most will match on the first pass.
- Chase the leftovers. For each meter that will not match, check the bill’s address, call the utility, or ask a site manager to photograph the meters on the wall.
- Add the codes. Assign each meter a cost center and GL code with finance.
- Sign it off. Facilities and finance agree the map in writing, with a date.
The leftovers in step five are where most of the value sits. They are usually closed sites, transferred accounts or meters nobody knew were on the bill. Each one is either a cost you should not be paying or a cost you have been booking to the wrong place.
Gas and water need maps too
Electric meters get the attention because demand charges make them expensive. Gas and water meters carry their own traps.
A restaurant group may have one gas meter for the kitchen and a second for space heating. A retail center may have a single water meter shared across tenants, with the cost split by lease formula rather than use. Irrigation meters often bill on their own accounts and run only half the year, which makes them easy to forget when they stop billing in winter.
Map every commodity with the same fields. A site’s total utility cost is only right when all of its meters are on the list.
Keep the map current
A map is accurate on the day it is signed and starts aging the next morning. The fix is a change log and a monthly habit.
Each month, compare the accounts on the new bills to the map. A new account, a new meter number or a missing bill each gets a line in the log: what changed, when and why. When a site opens, closes or changes use, the map changes with a written reason. That written reason is what we mean by moving the peg, and it is the only way the baseline should change.
Give the map one owner. Facilities usually knows when meters change; finance usually knows when accounts change. Whoever owns the map needs a standing line to both.
Four quick tests tell you whether a map has slipped:
- Count check. The number of accounts paid last month matches the number of active accounts on the map.
- Closed-site check. No site marked closed has a bill dated after its closing date.
- Cost-per-square-foot check. Sites of the same type and size land within a sensible range of each other.
- New-meter check. Every meter number on this month’s bills already appears on the map.
A failure on any of them is a line for the change log and usually a phone call.
The words you will meet
Meter mapping uses a handful of terms that utilities apply differently. Our utility billing glossary defines them plainly, including premise ID, meter multiplier, interval data, master meter and letter of authorization.
Two are worth knowing before you call a utility. A letter of authorization lets a third party pull your account data from the utility. Interval data is the 15-minute or hourly record from a smart or interval meter, and it is what lets you see a site’s load shape, not just its monthly total.
What the map makes possible
With a signed map, every later step has solid footing. Bills can be checked against the right site’s history. Weather-normalized baselines can be built site by site. Variances can be explained, because you know exactly which meters make up the number that moved.
That is the first phase of the Peg Baseline: collect 24 months of bills and interval data, map every meter to a site, weather-normalize, and agree the baseline in writing. Monthly utility bill tracking then keeps the map current as new bills arrive, with every new meter and closed account logged.
Start with one utility
If a full map feels large, start with your biggest utility and your 10 largest sites, then widen the list one utility at a time. Or send three bills from different sites for a free Three-Bill Read, and a utility analyst will show you what each bill says about the meters behind it.