See the peak before the bill
We read interval data as it arrives and flag new peaks.
- Length
- Ongoing, 12-month term
- Price, indicative
- From $18 per meter per month, 10-meter minimum
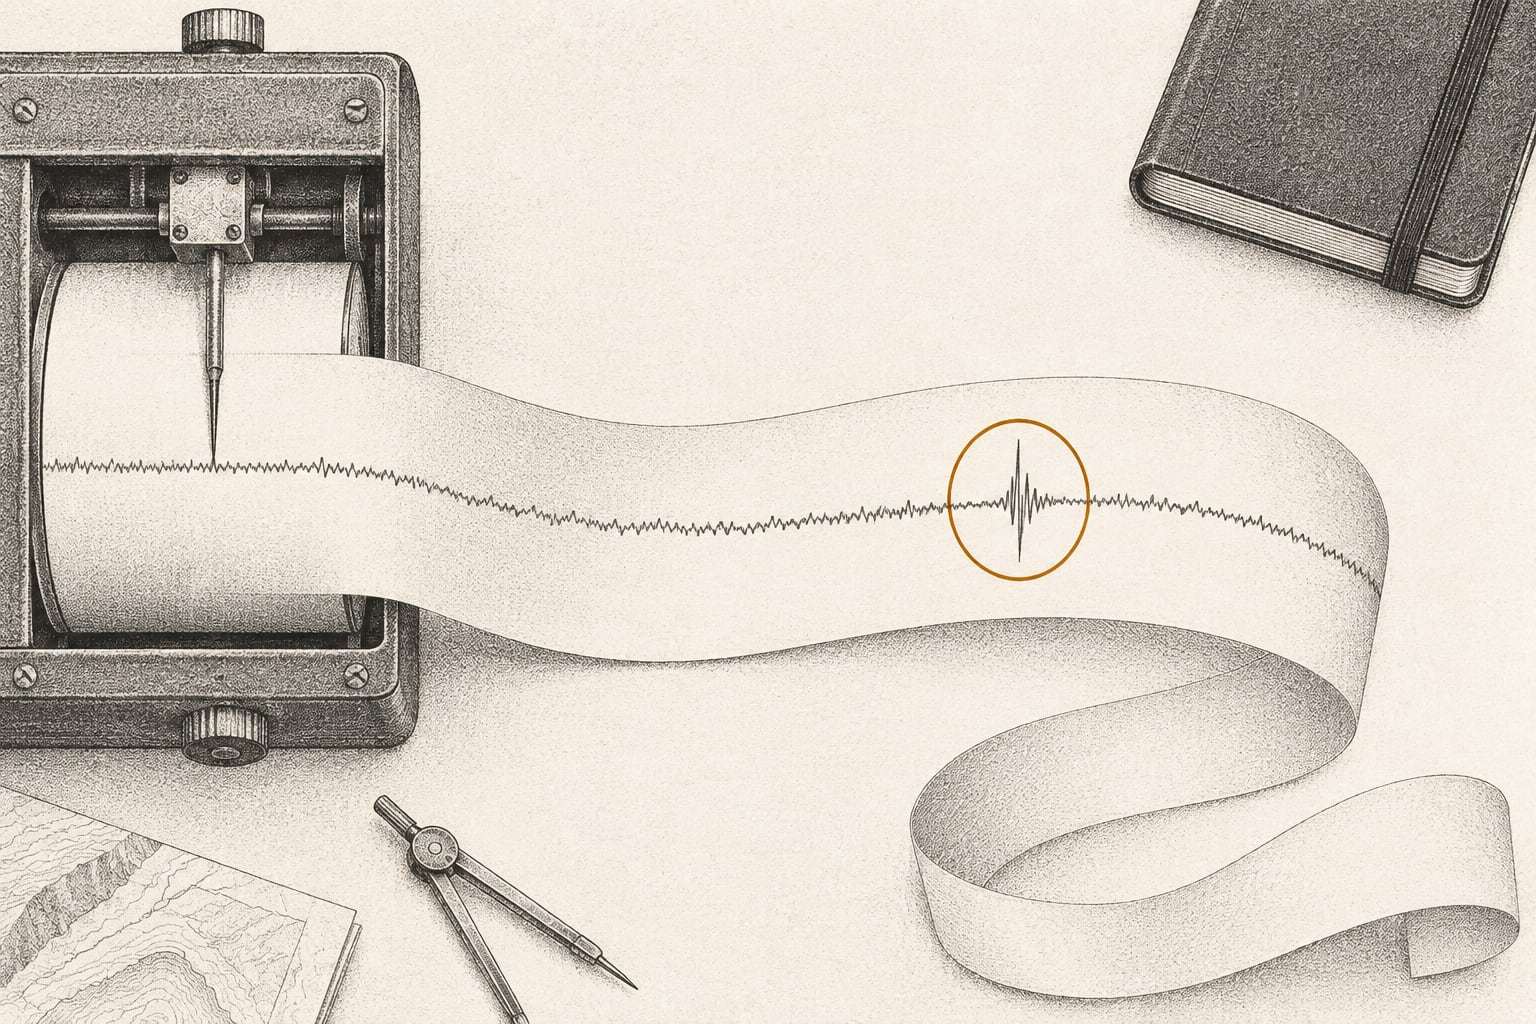
A monthly bill shows a demand charge weeks after its peak. Interval data shows the peak once posted, if someone looks. Interval Watch looks at every interval and writes within one business day.
Setup, then every interval read
- Weeks 1 to 2
Connect the data
Green Button downloads or the utility’s interval portal for each meter, under your letter of authorization.
- Week 3
Set the thresholds
Each meter’s normal load by hour and day type, from a Peg Baseline or 12 months of intervals.
- As data arrives
Drift and peak alerts
An email within one business day: the meter, the interval, the kW and what normal looks like.
- Monthly
Peak review
Which interval set each meter’s peak, what likely ran then, and whether it repeats.
- Each quarter
Retune the thresholds
Thresholds adjusted for season, hours and any site change you have told us about in writing.
What lands on your desk
- Who it is for
- Interval or smart meters only, 10 meters and up
- Format
- Email alerts within one business day, monthly peak review
- Alerts within one business day of data arriving, each with the meter, interval and load
- New-peak alerts when a meter sets a high for the billing period
- A monthly peak review: the interval that set each peak and what was likely running
- Per-meter thresholds by hour and day type, written down so your team can see them
- Interval data stored and exported each month as CSV, in your name
Where this program fits
A fit when
- Your sites have interval or smart meters and pay demand charges
- Equipment runs after hours and nobody notices until the bill
- Your sites share layouts, so one site’s odd load stands out
- You want to act on a new peak inside the same billing period
Not a fit when
- Your meters are read monthly only; we need interval data to watch
- You want real-time equipment control; that is a building automation contractor’s job
Example: a car wash chain with 18 tunnels
A car wash chain runs 18 tunnels from Thornton to Pueblo, each on a smart meter. In week four, an alert shows one site drawing about 40 kW overnight while the others sit near 5 kW; a vacuum was left running after close. The first peak review finds two sites peaking at opening, when dryers and pumps start together.
Questions about Interval Watch
How fast is an alert?
Within one business day of the data arriving from the utility. Utilities post interval data on their own schedule, often a day or more after the fact, so an alert is about yesterday, not this minute. That is still weeks before the bill, and early enough to change something this billing period.
Do we need new meters or hardware?
No. Interval Watch uses the interval data your utility already records on interval or smart meters, through Green Button downloads or the utility’s portal. A site with only a monthly-read meter cannot be watched this way, and we list which sites qualify before you sign.
What triggers an alert?
Two things. Drift: load outside the meter’s usual range for that hour and day type, such as overnight use well above its normal floor. A new peak: an interval higher than any so far in the billing period, because that interval may set the month’s demand charge.
Does it work with Peg Baseline or Bill Desk?
Yes. With a Peg Baseline, thresholds start from the signed baseline instead of raw history. With Bill Desk, alerts and the monthly bill check share one meter-to-site map, so a peak flagged in the data is matched to the demand charge on the bill when it arrives.
Start with three bills
A 30-minute call, or three recent bills, tells us whether Interval Watch fits your sites.